The Inventory Velocity Tax
📦 Break The Hidden $88K Trap in Your DTC P&L

Hey Readers 🥰
Welcome to today’s edition, bringing the latest growth stories fresh to your inbox.
And just a quick heads-up! If you stumbled upon us through a friend, make sure to subscribe below! That way, you’ll never miss out on the trending stories.
📦 The Inventory Velocity Tax: The Hidden $88K Trap in Your DTC P&L
Most brands think of slow inventory as a shipping problem. In reality, it’s a cash compounding problem, a quiet drain that strangles profitable growth even when your ROAS dashboard looks great.
Because every day inventory sits in transit, your future capital sits frozen.
Frozen capital can’t fund ads, can’t test creative, and can’t launch SKUs. It just waits.
The ICD Formula: Inventory Compounding Delay
Let’s name the problem: Inventory Compounding Delay (ICD) The formula is simple:
ICD = Manufacturing Time + Transit + Port Delay + Warehouse Intake
For most mid-stage brands, that adds up to 60–90 days. Which means you’re tying up working capital for 2–3 months before the first sale hits your dashboard.
Here’s the hidden math behind that:
- Brand selling 3,000 units/month
- $40 AOV with 40% gross margin → $16 profit/unit
- Inventory cycle: 75 days
- Required inventory on hand: ~7,500 units
That’s $120,000 in product sitting still. Only $16/unit is profit, but $40/unit is frozen capital. Even worse? You’re paying 30% tariffs upfront before your customer even clicks “Buy.”
Portless collapses that 75-day window to just 6 days. Your cash conversion cycle goes from quarterly to weekly. And because you pay tariffs only after selling, it’s not just faster, it’s fundamentally freer. So, Contact Portless to collapse inventory cycles from 60 days to 6.
Why Slow Inventory Kills Fast Brands
Slow inventory means:
- You can’t react to product winners mid-campaign
- You overbuy on SKUs that stall
- You limit promo flexibility because Ops says, “We don’t have enough stock.”
- You throttle ad spend during delays, even if ROAS is healthy
Your team ends up managing inventory… instead of accelerating growth.
How the Best Brands Operate Differently
Top 1% operators do two things differently:
- Tie campaign calendars to fulfillment velocity: They don’t just say “let’s launch the bundle in Q3.” They ask: “Can we get inventory out of Shenzhen within 48 hours of demand?”
- Reinvest weekly, not quarterly: With faster ICD, they can pump winners harder, test SKUs mid-promo, and loop profits faster. Marketing becomes cash-speed warfare, not just CTR optimization.
The Takeaway
If your P&L looks tight but your cash flow feels suffocated, the problem isn’t performance, it’s inventory drag.
ROAS ≠ growth is if the capital never comes back fast enough to be reused.
Collapse the delay. Collapse the risk. Then let your marketing team do what they’re best at: compound.
Partnership with Eko
Your product gallery holds the answers.

Most brands just aren't looking there.
Marketers spend hours optimizing ads and landing pages, but the real decision-making happens on your PDP. That's where shoppers compare and decide what to buy.
This guide from Eko breaks down what most brands overlook:
How product gallery engagement data can reveal what's working, what's missing, and what's slowing customers down.
See how brands like Mockingbird and Andie Swim improved conversion with simple changes. You’ll learn how to identify high-intent signals inside your gallery.
Get this playbook to build product pages that convert with more clarity and confidence.
Download the free guide from Eko and start using the data already on your site!
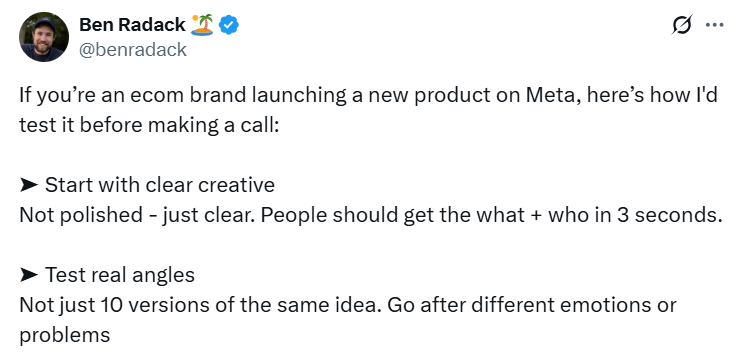
🗝️ Tweet of the Day
Advertise with Us
70% of email clicks are bots but not with The Playbook. Reach real human buyers with verified clicks and only pay for actual engagement.
We'd love to hear your feedback on today's issue! Simply reply to this email and share your thoughts on how we can improve our content and format. 😍